Volleyball Nations League 2018

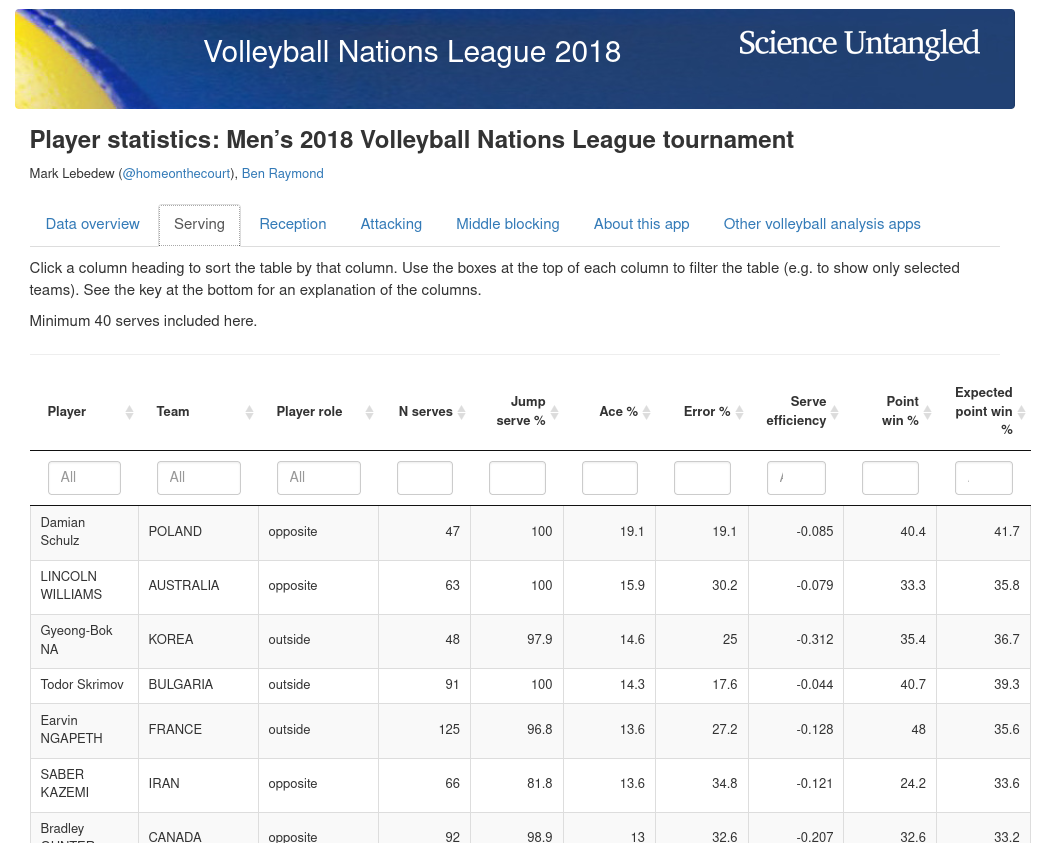
Player statistics: Men’s 2018 Volleyball Nations League tournament
Mark Lebedew (@homeonthecourt),
Data overview
The data used here include the full 120 matches from the preliminary round.
Data last updated: 28-Jun-2018
Serving
Click a column heading to sort the table by that column. Use the boxes at the top of each column to filter the table (e.g. to show only selected teams). See the key at the bottom for an explanation of the columns.
Minimum 40 serves included here.
Key
| Statistic | Explanation |
|---|---|
| Jump serve % | Percentage of serves by this player that were jump serves |
| Serve efficiency | (number of aces + number of serves rated positive - number of errors - number of serves rated negative) / (number of serves) |
| Point win % | Percentage of points won by the serving team when this player was serving |
| Expected point win % | The expected point win percentage based on the server’s serve ratings and the dataset-wide win percentage by rating. For example, ‘negative’ serves might correspond to a dataset-wide point win of 30%, and ‘ace’ to 100%. If a given server had one ‘negative’ serve and one ace, their expected point win % would be 65% |
Reception
Click a column heading to sort the table by that column. Use the boxes at the top of each column to filter the table (e.g. to show only rows corresponding to ‘libero’ players). See the key at the bottom for an explanation of the columns.
Minimum 50 receptions included here.
Key
| Statistic | Explanation |
|---|---|
| Reception efficiency | (number of receptions rated perfect or positive - number of errors - number of receptions rated negative) / (number of receptions) |
| Sideout % | Percentage of points won by the receiving team when this player received the serve |
| Expected sideout % | The expected sideout percentage based on the receiver’s pass ratings and the dataset-wide sideout % by rating. For example, ‘perfect’ receptions might correspond to a dataset-wide sideout % of 70%, and ‘poor’ to 40%. If a given receiver had one ‘perfect’ reception and one ‘poor’ one, their expected sideout % would be 55% |
Attacking
Click a column heading to sort the table by that column. Use the boxes at the top of each column to filter the table (e.g. to show only rows corresponding to ‘opposite’ players). See the key at the bottom for an explanation of the columns.
Minimum 50 attacks included here.
Key
| Statistic | Explanation |
|---|---|
| Attack efficiency | (number of kills - number of blocks - number of errors) / (number of attacks) |
| Point win % | Percentage of points won by the attacking team when this player attacked (at any time during the point) |
| First attack kill % | Percentage of reception attacks that were kills |
Middle blocking
Click a column heading to sort the table by that column. Use the boxes at the top of each column to filter the table (e.g. to show only selected teams). See the key at the bottom for an explanation of the columns.
Minimum 90 opposition attacks included here.
Key
Middle blocker statistics include all points where the blocker was front row.
| Statistic | Explanation |
|---|---|
| N opposition attacks | Total number of opposition attacks against this blocker |
| Block kill % | Block kills by this blocker as a percentage of N opposition attacks |
| Rallies won % | Percentage of points won by blocking team while this blocker was front row |
| Opposition attack % | Opposition attack percentage against this blocker |
| BP #+ rec | Percentage of points won by blocking team while serving, and opposition reception was positive or perfect |
About this app
This is not an official FIVB/Volleyball Nations League product.
The statistics reported here are generated from scouted match files. These files do not come from official sources, and so our stats are not necessarily the same as those provided by the FIVB.
See also Mark’s blog posts (1, 2, 3, 4) on VNL 2018 player rankings.
App version: 0.0.8
Data last updated: 28-Jun-2018
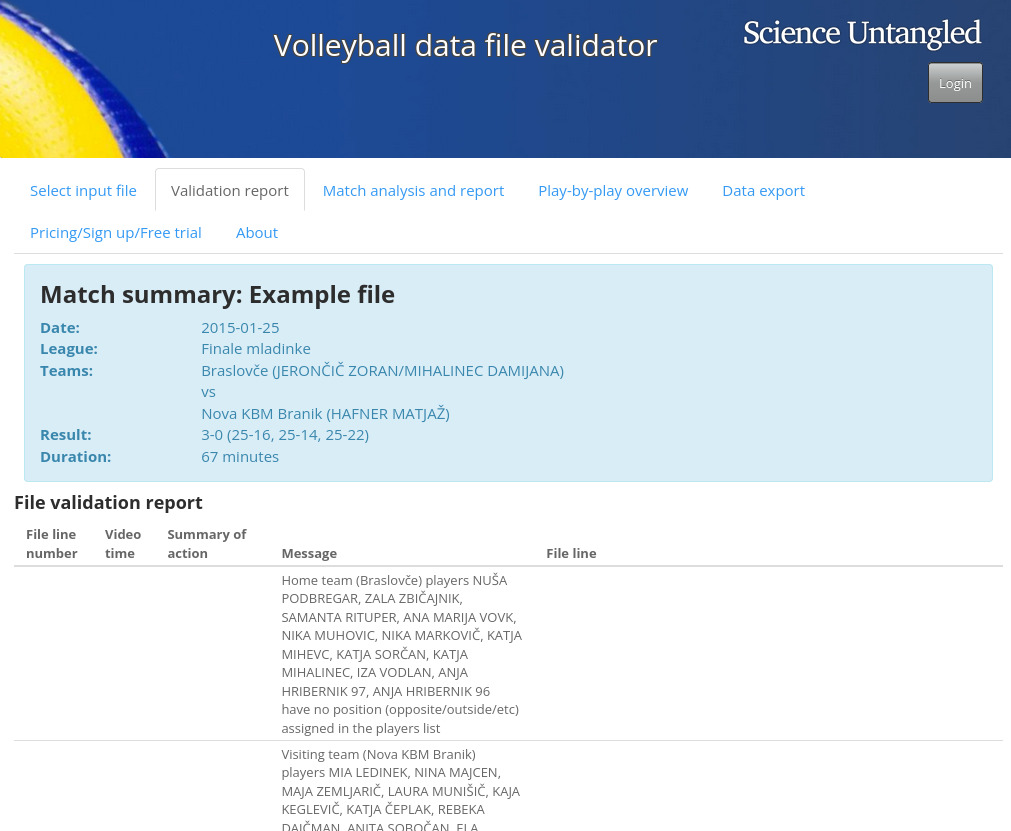
Other volleyball analysis apps
A validator to ensure that your scouted volleyball data files are as accurate as possible.
Works with DataVolley and AOC VBStats files.
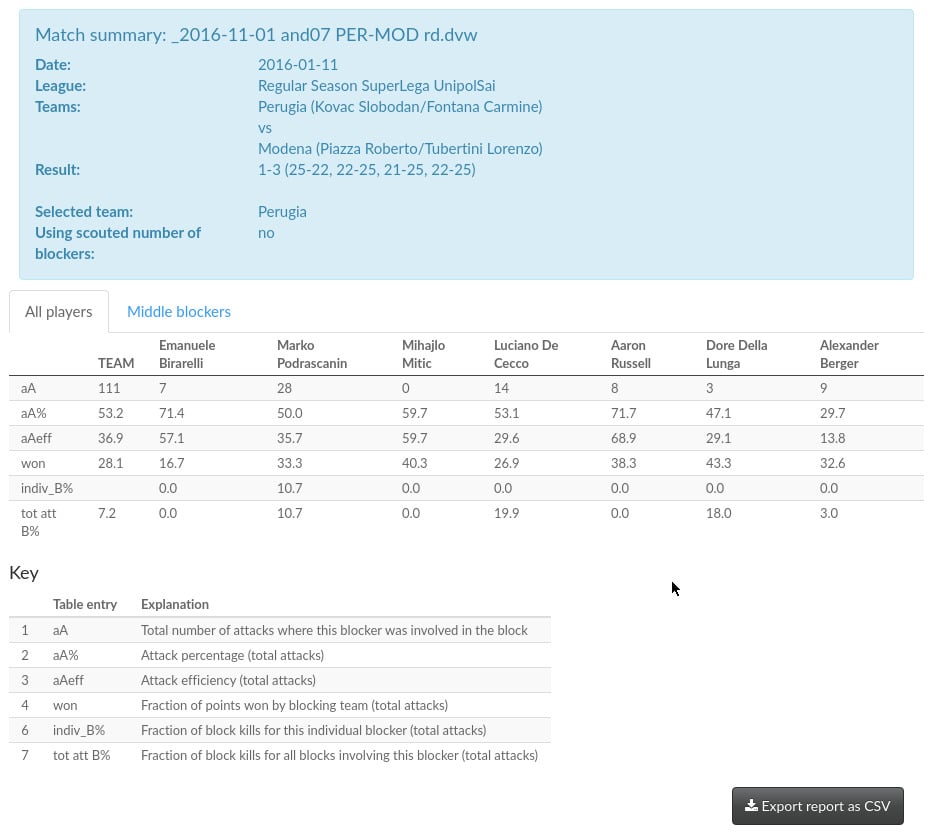
Analytical reports and interactive exploration of your volleyball data.
Works with DataVolley and AOC VBStats files.
Heatmaps, graphing, advanced analytics.
Detailed analysis of individual and team blocking performance.
Works with DataVolley and AOC VBStats files.
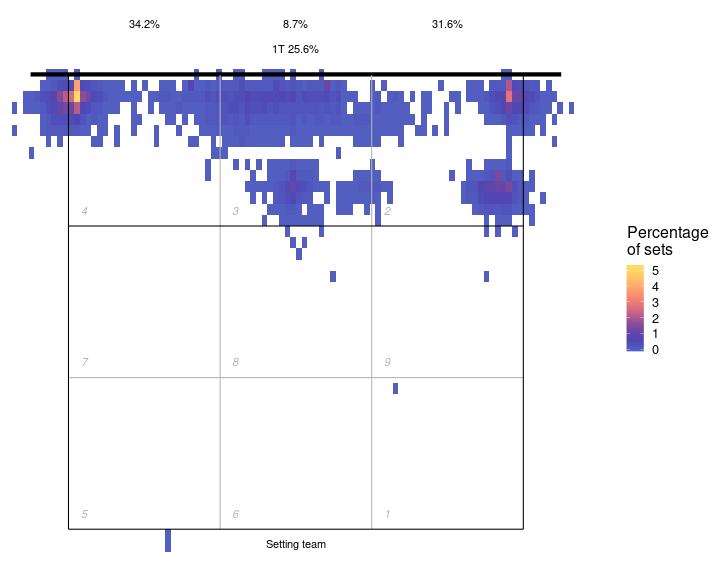
Interactive exploration of player and team setting patterns.
Works with DataVolley and AOC VBStats files.
Team reports.
Comprehensive PDF team reports for scouting or performance review.
Works with DataVolley and AOC VBStats files.
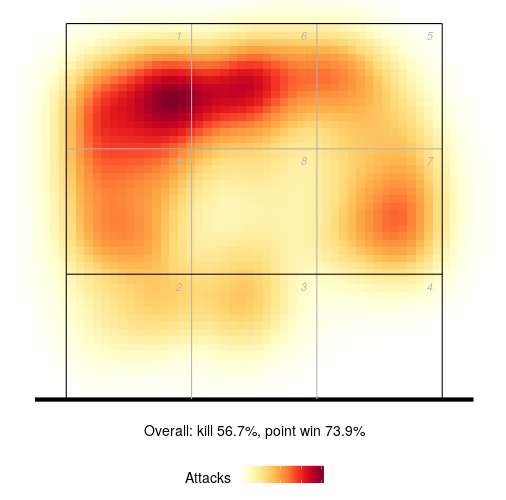
Interactive player and team attack charts and heatmaps.
Works with DataVolley and AOC VBStats files.
Player stats for the 2019 men's Volleyball Nations League.